We went looking for a usability study on tables in B2B software, one that tested filters, bulk actions, saved views, row height or sticky headers with real users. We did not find one.
What exists is guidance from design systems (a design system is a company's published rule book and parts kit for its screens), one expert review from Nielsen Norman Group, and practitioner blog posts. Of the top five search results we got for "saas data table ux" on Nov 10, 2026, we read two, and neither cites any research.
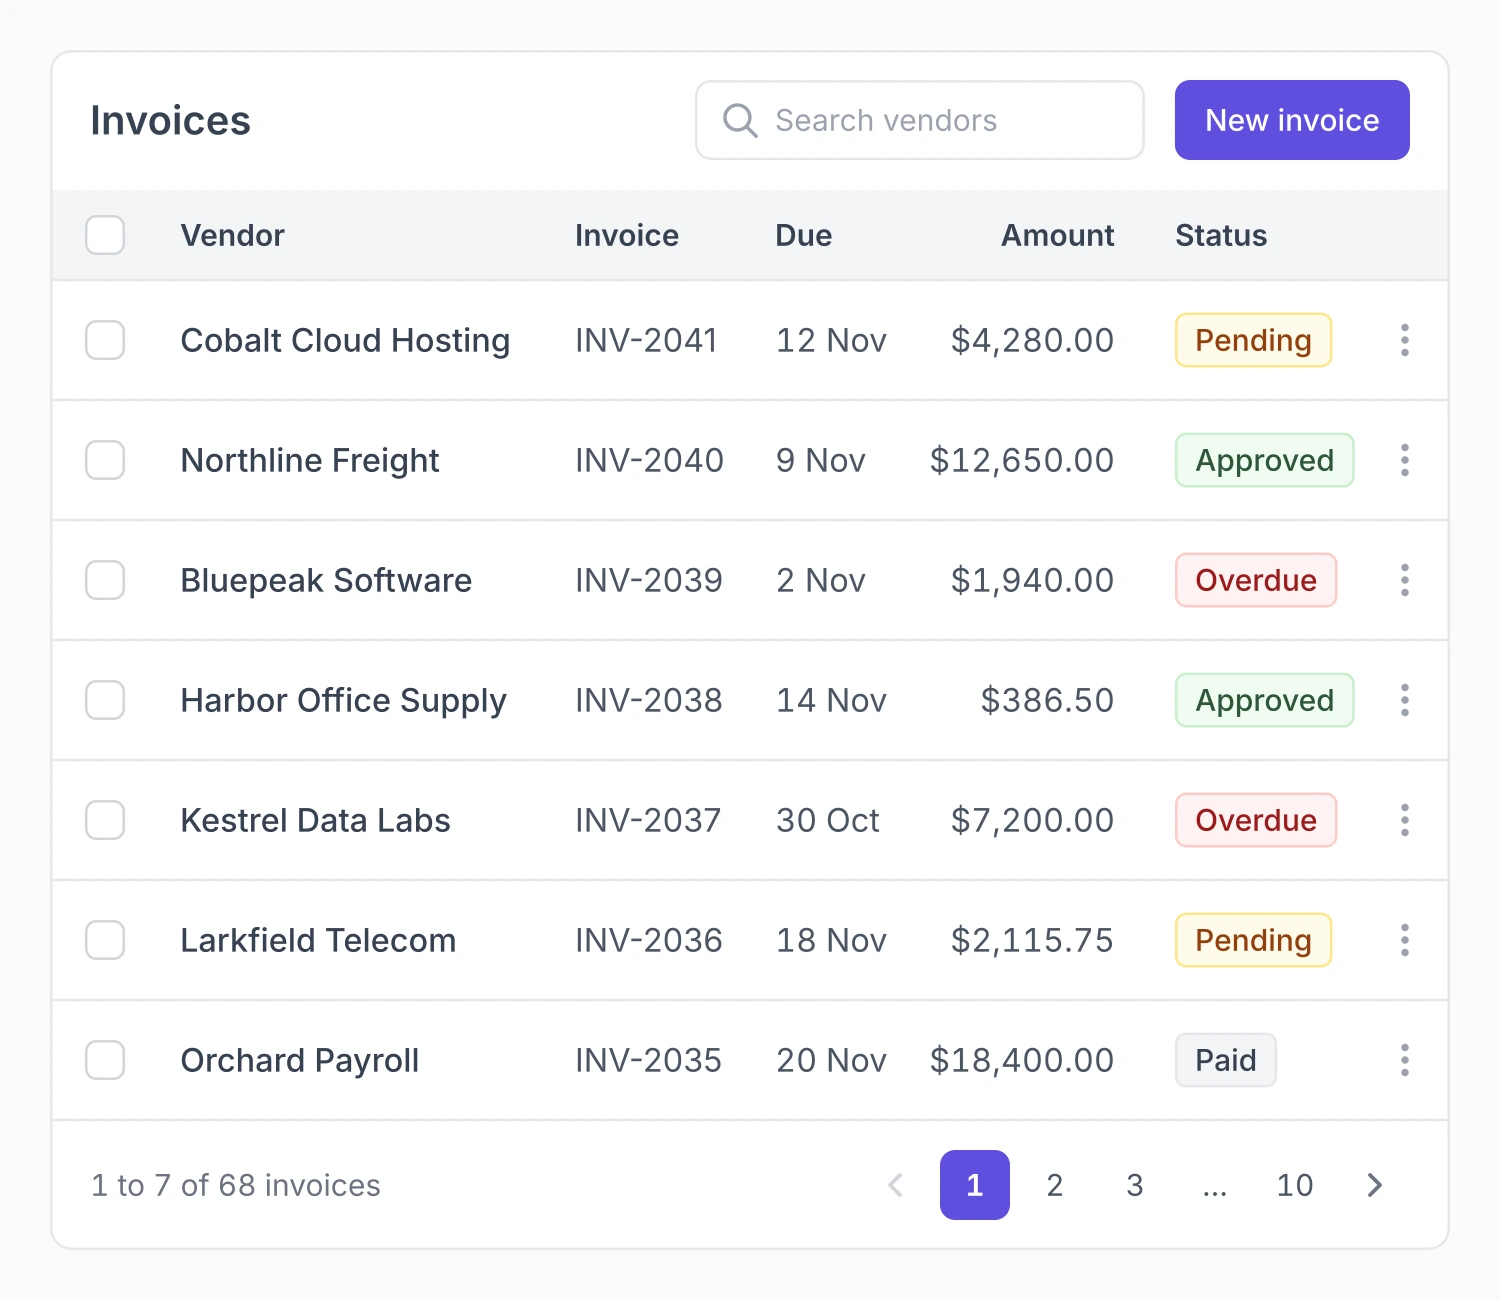
So this guide grades its own advice. For each pattern it says whether we read the source page, saw only a search summary of it, or are giving our own view. It is about the tables people use on a screen, not database tables. None of it is a client story. The pictures are drawn in the look of a table component kit in Figma.
Why tables decide B2B products
Nielsen Norman Group's 2022 article on data tables names four things people do in one: find records that fit some criteria, compare data, view or edit a single row, and take action on records. Filters serve the first job. Columns and density serve the second. Edit patterns serve the third, and bulk actions the fourth. This guide follows that order.
Our reading of why this matters so much in B2B: in a product built around records, such as invoices, vendors, tickets or flagged payments, those four jobs are most of what a user comes to do. That sentence is ours. The article is an expert review that reports no test of its own, and it looks at desktop only.
What the studies say
The research that exists is old and narrow. It compares tables with charts, and it supports one sentence: whether a table or a graph works better depends on the task.
Schonlau and Peters (2012) found graphs better for estimating differences, and tables better for estimating equality and sums. Meyer, Shamo and Gopher (1999) found that the edge graphs had over tables depended on whether the data had a structure the task relied on. Dickson, DeSanctis and McBride (1986) ran three experiments with business students and concluded that the best format depends on the task.
We read all three as abstracts only (the short summary at the top of a paper), and none is about software tables. On sorting, filtering, bulk actions, saved views, density, sticky headers and column resizing in B2B tables, we found no usability study at all.
How we mark the evidence
Read means we read the page itself on Nov 10, 2026. Summary only means we saw the short summary a search engine shows under a result and did not read the page. Our view means our own reading, which no source states.
The read pages are one guidance page each from four design systems (IBM Carbon, Ant Design, GitHub Primer and Atlassian), the W3C's grid pattern and its page on what is new in WCAG 2.2, the web accessibility standard, the Nielsen Norman Group article, two SaaSUI articles by Rakesh Mondal, and Lollypop's guide, which cites no sources. Each design system is one company's position on its own product. None of it is research. We could not read Shopify Polaris, Salesforce Lightning or Material Design, so they are missing here.
When a table is the wrong choice
Carbon says not to use a data table for complex displays, as a replacement for a spreadsheet, for nesting, or in small containers. Primer says not to use one for hierarchical data, for columns whose cells are usually empty, or for long text. SaaSUI is blunter: a table with 20 columns of equal weight has become a spreadsheet and stopped being a product screen.
Column basics the read sources agree on
Nielsen Norman Group says the first column should be something a person can read, such as a name, and not a generated code, and that related columns should sit next to each other. Primer says to right-align numbers and use tabular figures, which are digits of equal width, so amounts line up down a column. It also says to leave empty cells empty and not fill them with a placeholder character. SaaSUI agrees on alignment, with text to the left and numbers to the right, and says to choose columns for how people scan a row, not to show every field you store.
Filtering and saved views
Sorting is the best documented control. Carbon shows a sort arrow only on the column that is sorted, and the others show theirs on hover. Primer makes each header a button that sorts up or down. The W3C grid pattern asks for the aria-sort attribute on the sorted header. An aria attribute is a label in the code that a screen reader, software that reads the screen aloud, can announce.
Filters
Nielsen Norman Group says filters "need to be discoverable, quick, and powerful". It adds that a user should be able to see plainly what a filter is doing, and that active filters need a clear visual sign. SaaSUI's June article adds that filters should be worded in the team's own terms, and that the header row, the active filters and the bulk action bar should stay in view while the user scrolls.
One decision hides in a default. Ant Design sends the table back to page 1 after a filter is applied, and a product has to decide whether to keep that. Our view is to keep it, because page 7 of the old results means nothing in the new ones.
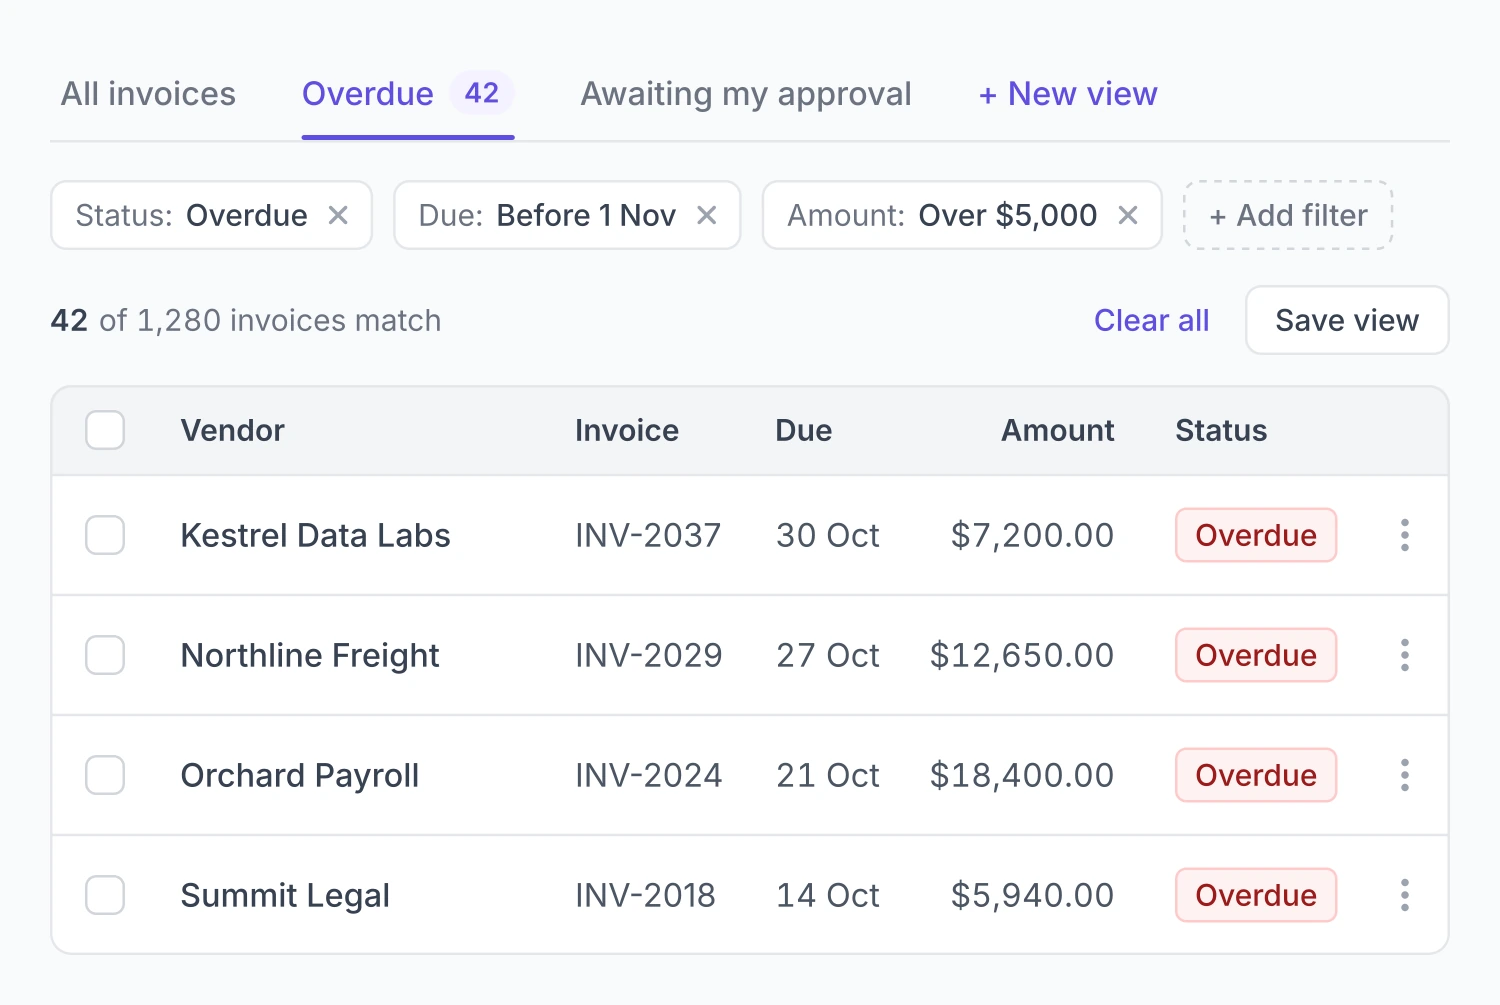
Chips are small tags that each name one active filter, and they are a common way to keep active filters visible. The article that describes them, a SaaSUI piece on filtering, is one we saw as a summary only. The same summary names a second choice: filters that apply as you pick them, or filters that wait for an Apply button. Our view is that live filtering suits a table that answers quickly, and an Apply button suits one where each query is slow.
Three states that should look different
SaaSUI's July article separates a table with no records yet, a table where the filter matched nothing, and a table that is still loading. The no-results state should offer to clear the filter. Its June article says the empty state should guide the user to add the first row. For loading, Carbon and SaaSUI both say to show skeleton rows: placeholder rows in the shape of the table, used in place of a spinner.
Saved views
A saved view is a named setup of a table that a user can return to. This is the weakest evidence in the guide. The only line we read is from SaaSUI: keep the user's last view and let them come back to it. Everything else is product help pages that we saw as summaries only, and they disagree with each other.
| Product | What a view saves | Who can see it |
|---|---|---|
| Basis | Sort order, column widths, custom columns | Not in the summary |
| Forerunner | Columns, filters, sort rules | Internal or public |
| PostHog | Which columns show and their order, with filters | Private, or shared with the project |
| Procore | Not in the summary | One user, who can share it |
| Occupier | Filters only | Everyone in the account |
| Coralogix | Query, filters and table settings, carried in the page link | A teammate who is sent the link |
| Smartsheet | Filters | Not in the summary |
There is no standard to copy. That leaves two choices to make on purpose. The first is what a view saves: filters only, or the whole layout with columns, widths and sort. The second is who sees it by default: only the person who made it, the people it is shared with, or the whole account.
Our view on the trade-off, with no source behind it. A filters-only view is easy to explain, but two people opening it can still see different columns. A whole-layout view shows a colleague exactly what you saw, and gives you more to keep working when columns change. Sharing by default helps a team talk about the same list, and fills the list of views quickly.
Bulk actions and selection
This is where the read sources agree most closely.
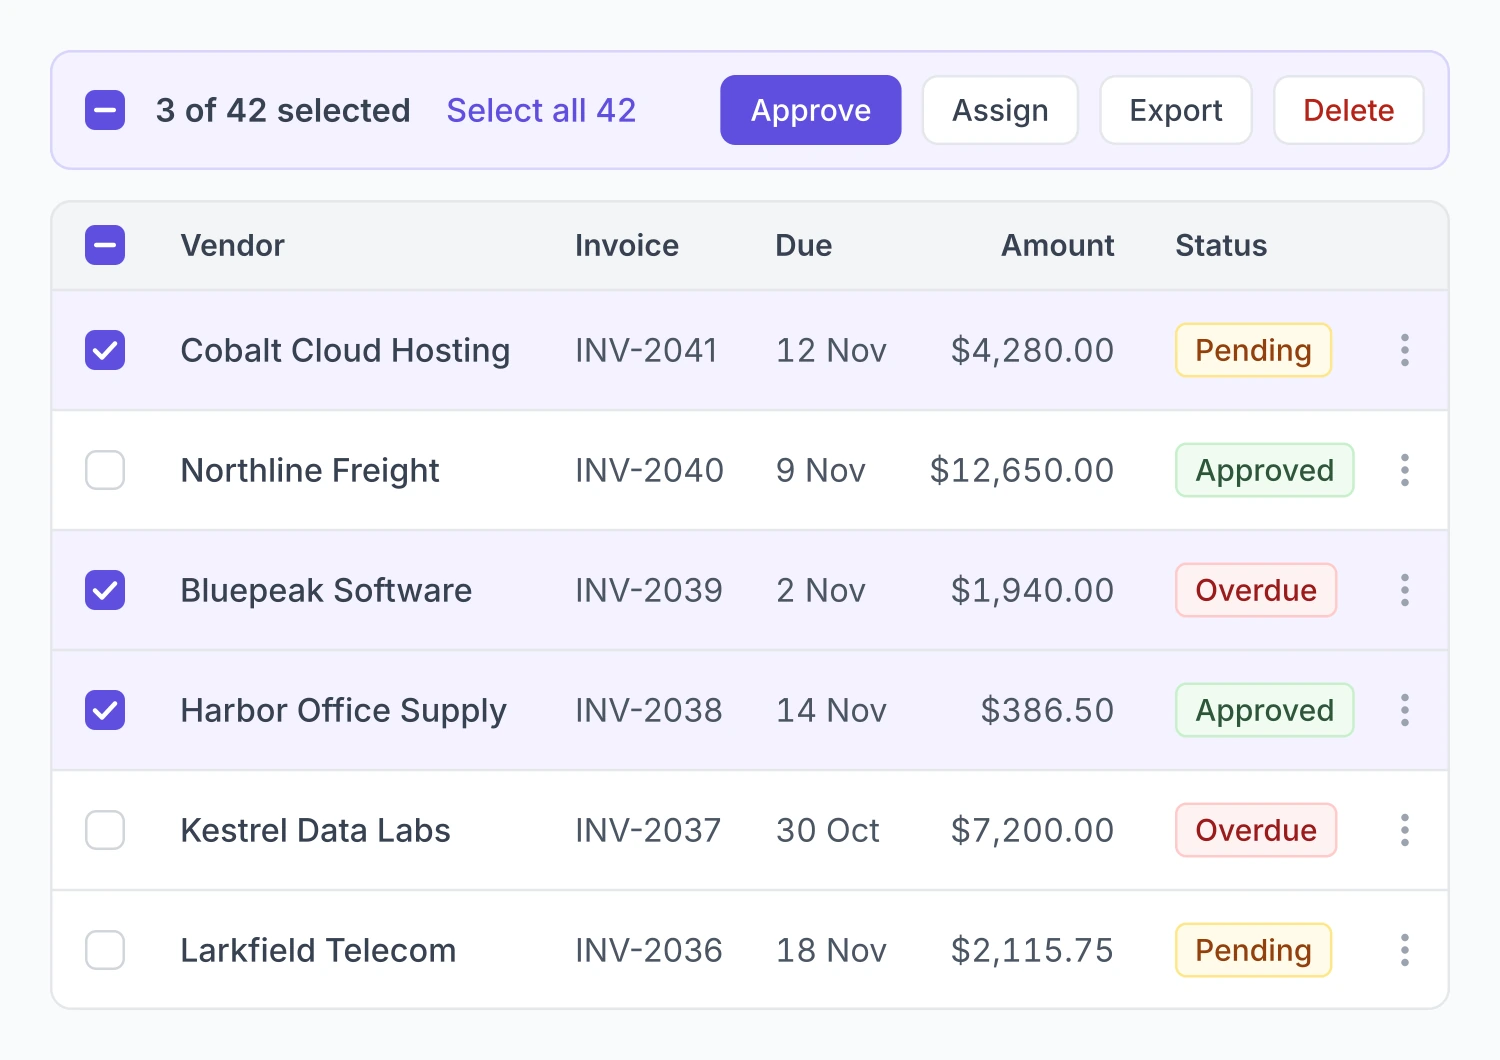
Carbon puts a checkbox on each row for selecting many rows, and a radio button when only one row can be chosen. The header checkbox can show a partly ticked state when only some rows are selected. Once rows are selected, a bar of bulk actions appears above the table. While that bar is open, the action icons and menus on single rows are switched off.
Nielsen Norman Group describes the same shape: row checkboxes, action buttons or menus above or below the table, and a Select All when bulk actions are common.
Show selection in more than one way
Lollypop says selected rows need a background highlight, not only a ticked box. Atlassian comes at it from the other side: selection or focus must not rely on a highlighted row alone. Put together, a selected row gets both a tick and a highlight. Atlassian also asks for a unique label on each row's edit button, one that names the row.
For the keyboard, the W3C grid pattern lists the usual keys. Shift+Space selects a row, Ctrl+Space a column and Ctrl+A everything.
What Select All covers
None of the pages we read says whether Select All means the rows on this page or every row that matches the filter. On a table with 42 matches and 10 rows a page, those are different actions. Our view, with no source behind it: say the count in the bar, and make selecting every match a separate step the user takes knowingly.
Guard rails
Two come from pages we read. SaaSUI says destructive bulk actions need a confirmation step; that is one vendor's line. Nielsen Norman Group warns about the single-row side: once a row carries more than one or two actions, they get crowded, lose their labels, or hide behind hover and menus, and become harder to find.
The rest comes from pages we saw as summaries only. A Nielsen Norman Group video on bulk actions is summarised as recommending Select All, an action bar that appears in context, and clear feedback with undo. Eleken reports that hiding checkboxes until hover cut clutter but made selection harder to discover. It also names a common failure: a bulk action that changes some of the selected rows and not others, and does not say why.
The hover finding is the trade-off in small. Always-visible checkboxes cost a column, and hidden ones look cleaner and are easier to miss. Our view is that where bulk work is routine, the checkboxes stay visible.
WCAG 2.2 has a target size rule (2.5.8, level AA) that applies to row checkboxes and row action buttons: a target for a pointer is at least 24 by 24 CSS pixels, with five named exceptions, spacing among them. That is what can be said on bulk actions UX with a source behind it.
Inline edit, drawer or full page
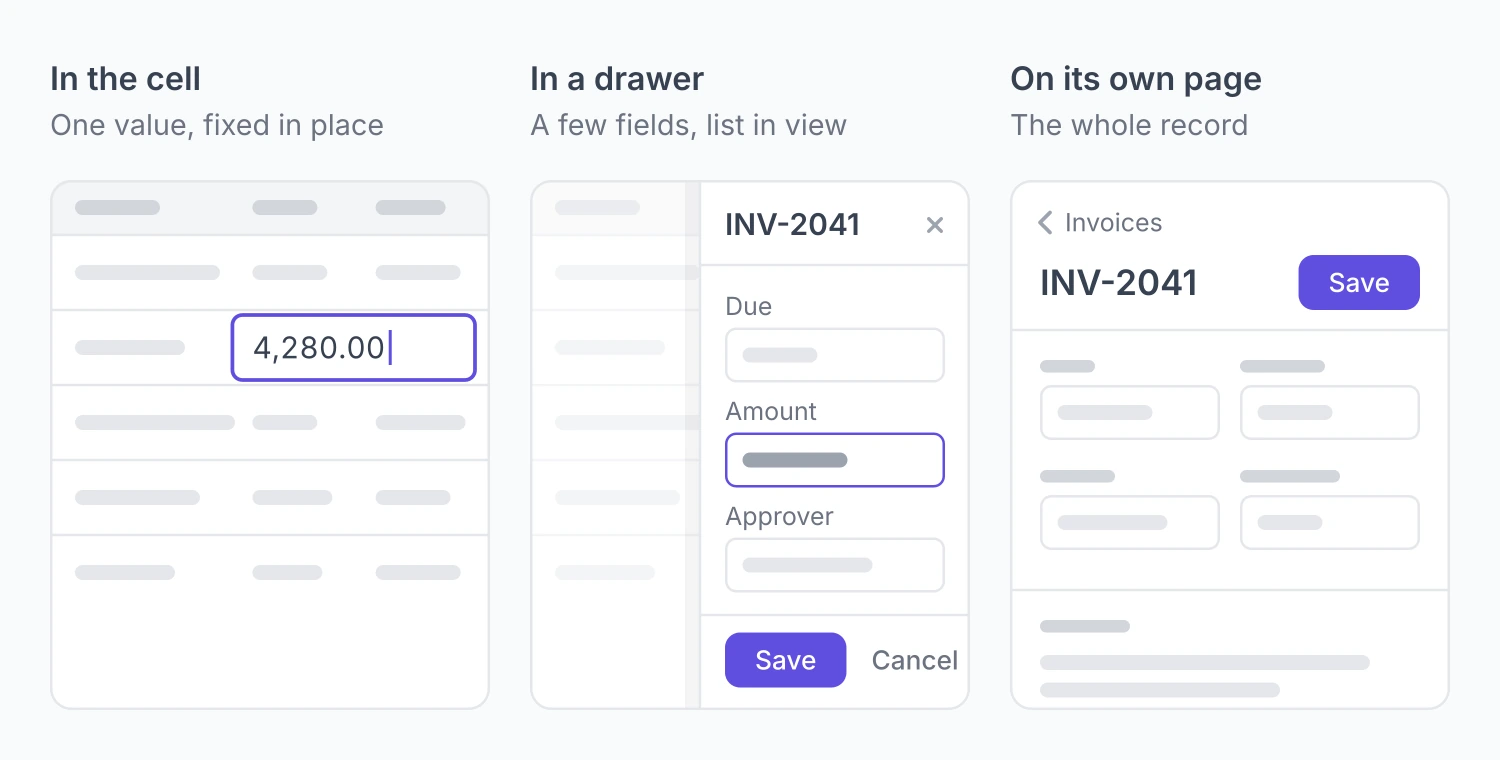
There are three common places to edit a record from a table. In the cell itself, which is inline edit. In a drawer, a panel that slides in from the side while the table stays on screen. Or on a page of its own. A fourth, the modal, is a pop-up window that blocks the page behind it.
No source we read gives a rule for choosing between them. The read sources give pieces.
Nielsen Norman Group says editing in place only works when the table is narrow, and that edit mode must look visibly different so people do not change values by accident. A modal covers the neighbouring records and is discouraged for deep editing. A side panel that does not block the page keeps the table in view. An accordion, where the row expands in place, gets cluttered when users leave several open.
Atlassian says that in more complex tables, with several kinds of editable content, an edit link should sit in the row's more-actions menu and open a modal or a dedicated page, not input fields. The W3C grid pattern gives the usual keys: Enter or F2 moves into a cell to edit it, and Escape goes back to moving around the grid.
Where two read sources disagree
Nielsen Norman Group discourages modals for deep editing. Atlassian names a modal as one of its two routes for complex tables. One is an expert's position and the other a vendor's, and neither cites a study for it.
Pieces we saw as summaries only
PatternFly is summarised as sending an edit of many fields at once to a full edit page. A SaaSUI article on drawers is summarised as warning about drawers stacked on drawers, and about a drawer that closes on an outside click or the Escape key and loses what the user typed. The summary adds that a drawer that covers everything may be better as a page.
Our working rule
Putting those pieces together gives a rule of thumb. No source states it and no controlled study compares the three options, so treat it as our view.
| Where | Use it when | What you give up |
|---|---|---|
| In the cell | One field, low stakes, a narrow table | Room for help text and checks, and some safety against accidental changes |
| In a drawer | The user needs the list in view while editing | Width for the form, and typed input if the drawer closes too easily |
| On its own page | Many fields, several steps, or a change that is costly to get wrong | Sight of the list, so the user has to find their place again |
The right-hand column is why we would not pick one pattern for a whole product.
When a save fails
The only rule on error states that we read is Atlassian's: mark the affected row or input with an error icon and explain how to fix it. Its example message tells the user the row could not be added and asks them to try again.
Two summaries we saw go another way. Semrush keeps an error state for back-end failures that stop data from showing, and Dynatrace folds errors into its empty state. We lean on Atlassian's rule only because it is the one we read.
Density and column control
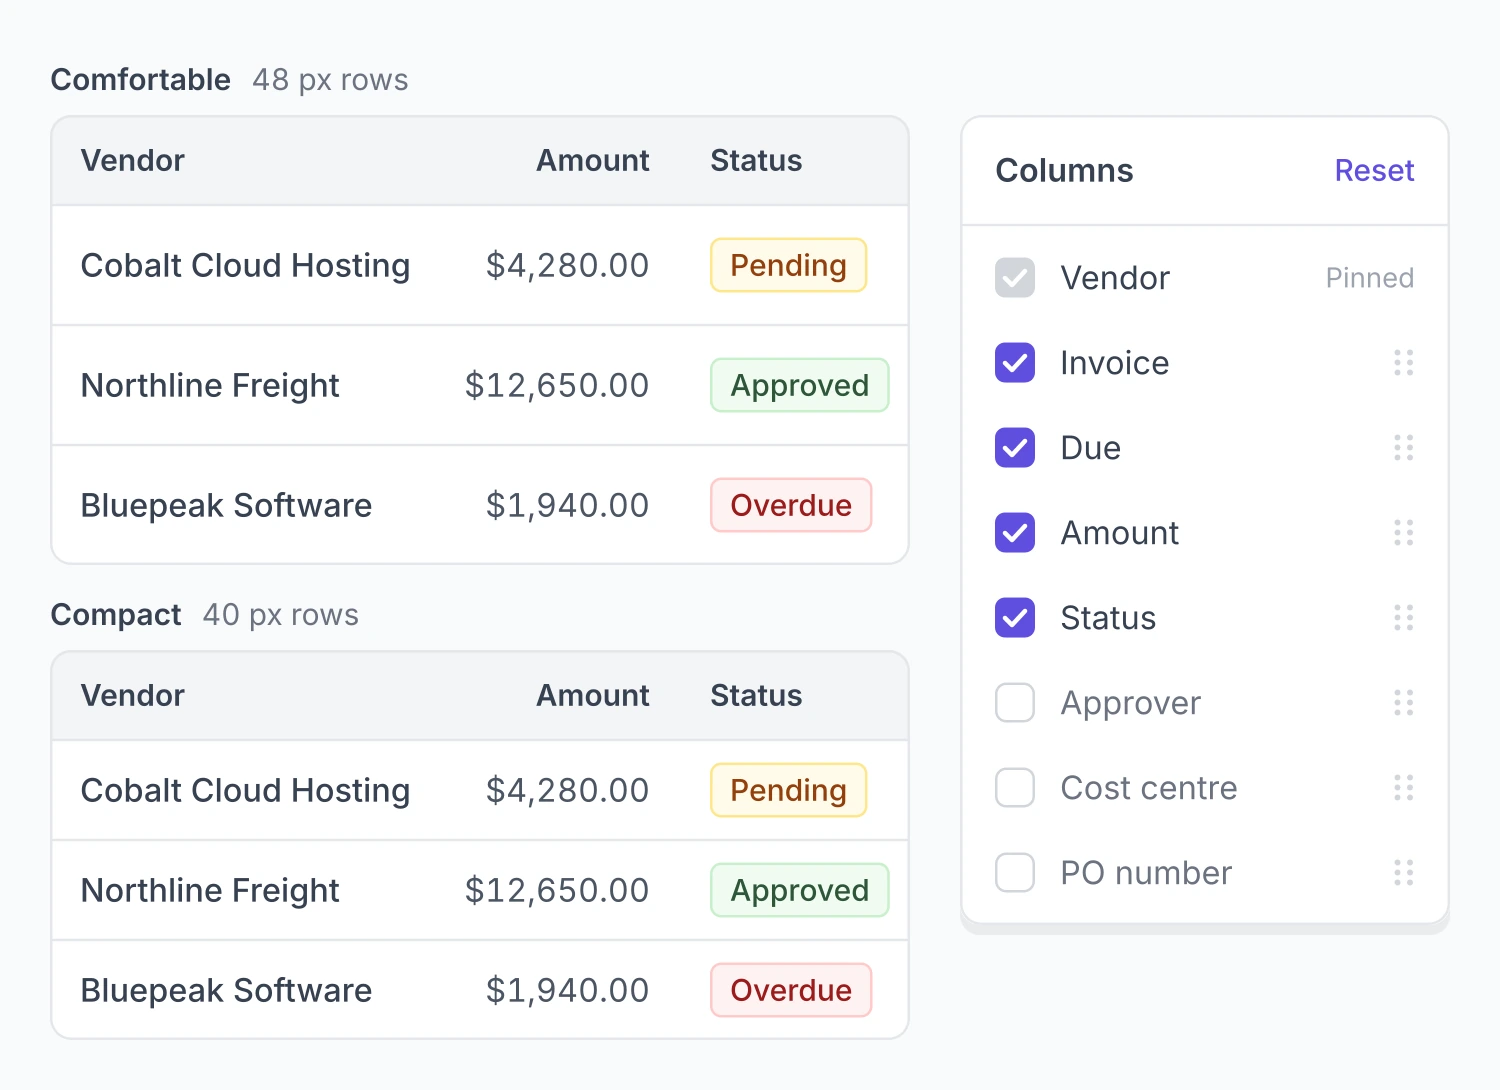
Density is how tall the rows are, and so how many fit on a screen.
| Source | Row heights | Default or preference |
|---|---|---|
| IBM Carbon | 24, 32, 40, 48 and 64px | 40px |
| Ant Design | Small, medium and large | Large |
| Lollypop | 40, 48 and 56px | 48 or 56px, with no test cited |
In Carbon, the header row, toolbar and pagination match the row height, and 64px is kept for rows with two lines of content.
This is the first of two open conflicts in this guide. Carbon's documented default is 40px, and Lollypop prefers 48px or 56px without citing a test. We found no controlled study on density, so nobody, us included, can say which default is right.
SaaSUI's July article argues for a density toggle and user-controlled columns in place of one fixed setting, which hands the choice to the user. Our case study on Drivetrain, a planning platform for finance teams, describes the same pull: the product leaned on pivot tables and dense grids, which pull data richness and visual calm in opposite directions.
Hiding and reordering columns
Nielsen Norman Group says hiding and reordering columns must be easy and must not depend on drag and drop alone. Dragging a header is quick once learned, hard to discover, and poor for accessibility. It recommends a menu as the other route, and a visible sign that columns are hidden. The example menu in its article notes 15 hidden columns. WCAG 2.2 has a rule to match, on dragging movements (2.5.7, level AA): anything done by dragging must also be possible with a single pointer and no drag, unless the drag is essential.
Column resizing has almost no guidance
We found no design system rule for column resizing. Carbon's page does not cover it, Ant Design offers only width and minimum-width settings, Atlassian says nothing, and we have nothing recorded for Primer. SaaSUI's July article says to let users resize columns and remember the choice, and says nothing on how.
The only other guidance we saw is build notes from TanStack, a code library, as a summary: show a handle only on columns that can be resized, and apply the new width when the drag ends, because live updates can lag on complex tables. That helps engineers more than designers.
Keeping headers in place
Nielsen Norman Group says to freeze the header row and the header column when a table is larger than the screen, with a subtle drop shadow so the frozen parts read as floating. It also suggests light borders, zebra stripes and a hover state on rows to help the eye track across.
There is a cost for keyboard users. A sticky header can sit on top of the cell that has focus. WCAG 2.2 has a rule for this, 2.4.11 Focus Not Obscured (Minimum), at level AA: the item that has keyboard focus must not be entirely hidden by content the author added. The rule does not say how to fix it. Our view is to leave room at the top of the scroll area equal to the height of the header, so a focused row never sits under it.
Pages or endless scroll
Carbon puts pagination at the bottom of the table. Primer suggests 20 rows as a starting page length, with the user's position shown against the total. Ant Design also offers virtual scrolling, where only the rows on screen are drawn.
Here is the second open conflict.
Nielsen Norman Group, in two pages we saw as summaries only, says infinite scroll is not the answer for most websites and suits goal-driven visits poorly. It says pagination is usually better for long lists. Those pages are about websites and online shops, not B2B apps.
Lollypop, which we read, prefers a load-more button or infinite scroll for smoother browsing. It admits that with infinite scroll, users may find it harder to get back to earlier rows, and the total may not be clear. It cites nothing.
SaaSUI, also read, splits by task: pagination for reference and audit work, virtual scroll for continuous monitoring.
So the bigger name is unread and about a different kind of product, and the read source has no evidence behind it. If you have to choose today, SaaSUI's split at least ties the choice to the job. That is our view.
Audit trails and history
Except for two side notes marked below, the audit advice here rests on pages we saw as search summaries only, most of them product help pages. No design system page we read covers audit tables, and we found no research on them.
The summaries agree on a rough shape.
- Nutrient's changelog records who made each change, when, and what it affected. It colours each type of operation, green for inserts and blue for updates.
- The PASIprep audit grid has no row actions: no checkbox, view or edit column.
- SaaSFrame's pattern page says to state up front what the log is for and what it covers, and not to imply it is more complete than it is.
Two read sources touch the topic from the side. SaaSUI groups audit work with pagination, and the W3C grid pattern has an aria-readonly attribute that tells assistive technology a grid cannot be edited, which fits a log.
A starting shape, marked as ours
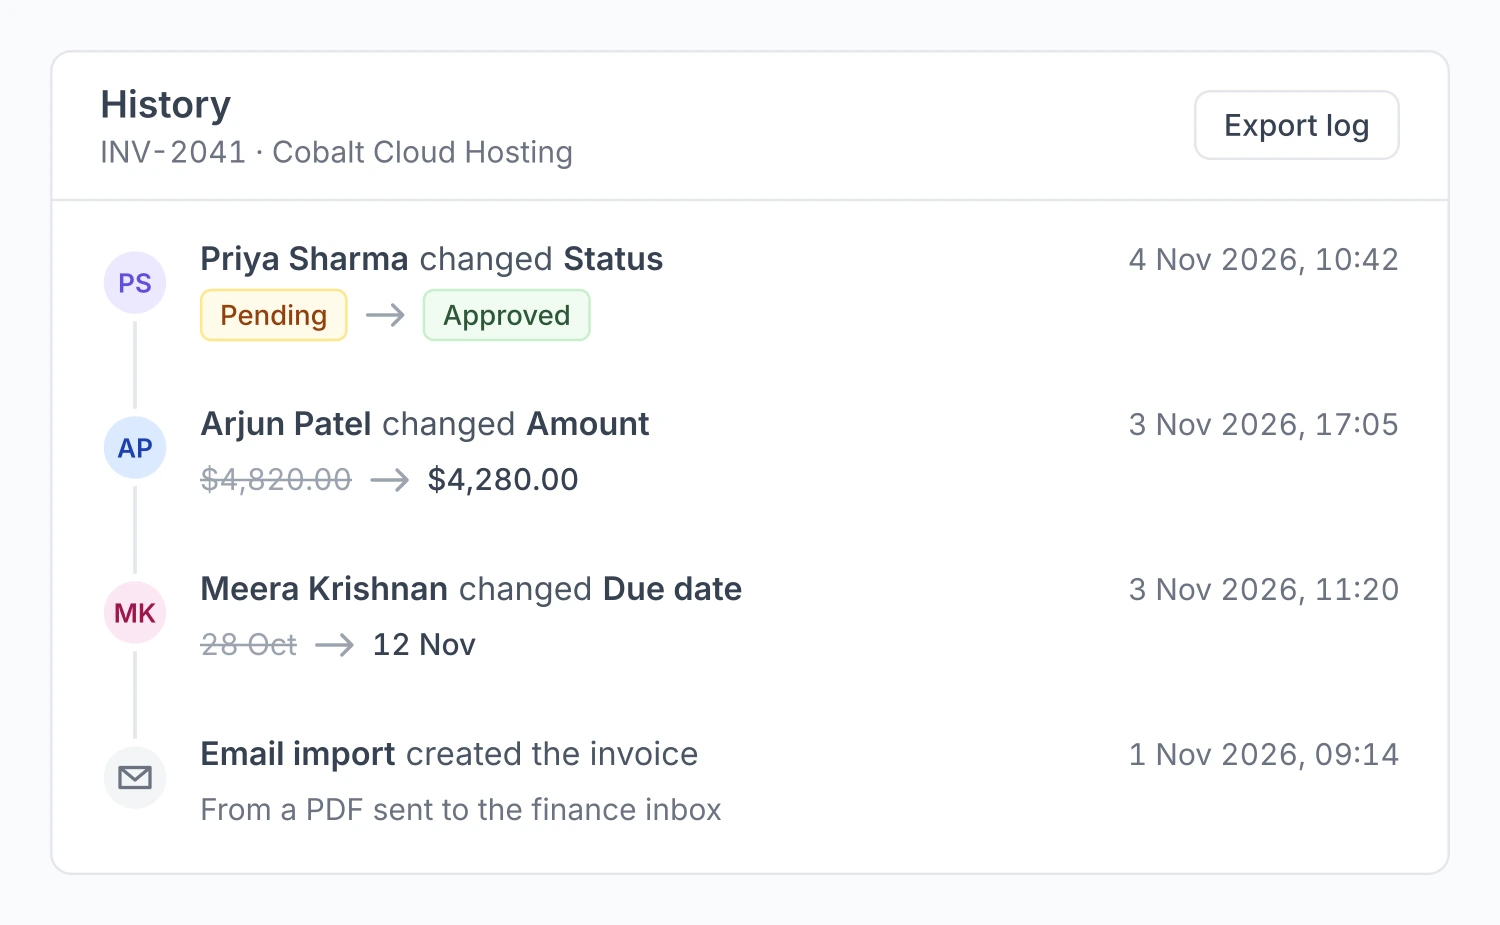
From those pieces, our suggested minimum for an audit table is short. Columns for who made the change, when, what changed and which record it touched. Filters and an export. No row actions. A line on the screen saying what the log covers. The filters and export are our own addition, the rest is our inference from the summaries, and no industry rule says it.
A row history panel is the same idea for a single record. Showing the old value beside the new one for each change is also our suggestion. The summaries say only that a trail records what a change affected.
Audit trails also matter when software acts for people. On Spendflo, a procure-to-pay platform where turingLabs runs design as a fractional team, the agent features sit beside versioning, an audit trail of every run, and permissions that follow the roles the company already has. Our guide to agentic AI product design covers that side.
A checklist before a table ships
Each line carries its mark, so you can see which ones to treat as settled.
| Check | Backing |
|---|---|
| The first column is a name a person can read, and related columns sit together | Read: Nielsen Norman Group, SaaSUI |
| Numbers are right-aligned with equal-width digits; text is left-aligned | Read: Primer, SaaSUI |
| Active filters are visible and worded in the team's own terms | Read: Nielsen Norman Group, SaaSUI |
| The table remembers the user's last view | Read, one source: SaaSUI |
| What a saved view saves, and who sees it by default, is decided on purpose | Our view, from seven product help pages seen as summaries only |
| Rows have checkboxes, there is a Select All, and a bulk bar appears above the table | Read: Carbon, Nielsen Norman Group |
| Destructive bulk actions ask for confirmation | Read, one source: SaaSUI |
| A bulk action gives feedback with undo, and a partial failure is explained | Summary only: Nielsen Norman Group video, Eleken |
| Edit mode looks different; Enter or F2 starts an edit and Escape leaves it | Read: Nielsen Norman Group, W3C |
| One field inline, a drawer to keep the list in view, a page for long or risky edits | Our view |
| Columns can be hidden and reordered from a menu, and the table shows how many are hidden | Read: Nielsen Norman Group |
| Row height is chosen on purpose, with a toggle if your users differ | Read, sources disagree: Carbon, Lollypop, SaaSUI |
| Pagination for reference and audit work, virtual scroll for monitoring | Read, one source: SaaSUI |
| Skeleton rows show while loading; an empty table guides the first row; a no-results table offers to clear the filter | Read: Carbon, SaaSUI |
| An error shows on the affected row or field, with a way to fix it | Read, one source: Atlassian |
| The audit table shows who, when, what and which record, with filters, export and no row actions | Our view, built on summaries only |
Column resizing is missing on purpose. One read source says to offer it, and we found no rule on how it should work.
FAQ
What makes good SaaS data table UX?
A table that does four jobs well: finding records, comparing them, opening or editing one, and acting on many. Those are the four tasks Nielsen Norman Group names. In practice that means visible filters, columns chosen for scanning, a clear edit mode and a bulk action bar. Past those basics the published sources stop agreeing.
Which table design best practices have real backing?
For tables on a screen, the ones several read sources repeat: a readable first column, right-aligned numbers, visible active filters, row checkboxes with a bulk bar, and skeleton rows while loading. Backing here means design system guidance and one expert review. We found no usability study on any of them in B2B tables.
How should bulk actions work in a table?
Put a checkbox on each row and one in the header, and show a bar of actions above the table once something is selected. That is IBM Carbon's pattern, and Nielsen Norman Group describes the same shape. Say how many rows are selected and confirm anything destructive.
Should a B2B table use pagination or infinite scroll?
The sources disagree. Nielsen Norman Group's caution about infinite scroll is about websites, and we saw it as summaries only. Lollypop prefers load-more or infinite scroll and cites no evidence. SaaSUI splits by task, with pagination for reference and audit work and virtual scroll for monitoring. We would start from that split.
What row height should an enterprise table use?
Enterprise table design has no agreed default. IBM Carbon defaults to 40px out of five heights from 24px to 64px. Lollypop prefers 48px or 56px and cites no test. With no study to settle it, a density toggle lets users choose.
Working on a table-heavy product?
Tell us which table your users spend the most time in and where they get stuck. We have designed B2B products in finance planning (Drivetrain), fraud detection (Effectiv) and procurement (Spendflo). Book a call.
Sources
Every page below was read or searched on Nov 10, 2026.
Pages we read: IBM Carbon's data table usage page, dated Sep 30, 2026 (carbondesignsystem.com); Ant Design's Table page (ant.design); GitHub Primer's DataTable guidelines (primer.style); Atlassian's Dynamic table usage page (atlassian.design); the W3C's grid pattern (w3.org) and its page on what is new in WCAG 2.2, dated Oct 5, 2023 (w3.org); Nielsen Norman Group's Data Tables: Four Major User Tasks, Apr 3, 2022 (nngroup.com); Rakesh Mondal's two SaaSUI articles, of Jun 6, 2026 (saasui.design) and Jul 2, 2026 (saasui.design); and Lollypop's guide to data tables, posted Mar 20, 2026 and updated Nov 3, 2026 (lollypop.design).
Studies, read as abstracts only: Schonlau and Peters, 2012 (ideas.repec.org); Meyer, Shamo and Gopher, 1999 (doi.org); and Dickson, DeSanctis and McBride, 1986 (doi.org).
Pages we saw as search summaries only and did not read. On filters, drawers, bulk actions, scrolling and resizing: SaaSUI on filtering and sorting (saasui.design) and on drawers (saasui.design); Nielsen Norman Group's video on bulk actions (nngroup.com) and its two pages on infinite scrolling (nngroup.com, nngroup.com); Eleken on bulk actions (eleken.co); PatternFly on inline edit (patternfly.org); and TanStack Table on column resizing (tanstack.com). On saved views: design.basis.com, withforerunner.com, posthog.com, support.procore.com, help.occupier.com, coralogix.com and smartsheet.com. On audit trails: nutrient.io, extranet.education.alberta.ca and saasframe.io. On error states: developer.semrush.com and developer.dynatrace.com.
Our own facts come from turinglabs.in.